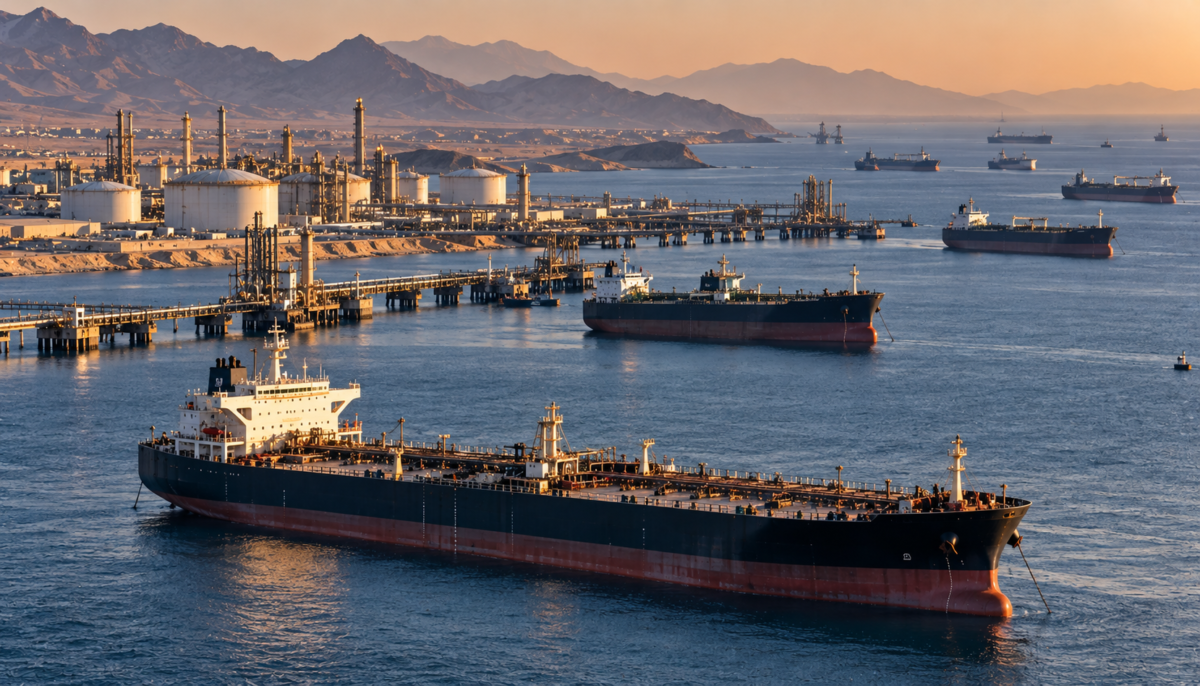

Global oil price volatility has become the primary driver of energy market sentiment as the crisis in the Strait of Hormuz reaches a critical inflection point in July 2026. On July 20, the energy sector witnessed Brent crude futures breach the psychologically significant $90 mark, peaking at approximately $91.42 per barrel before settling slightly lower. West Texas Intermediate (WTI) followed a similar trajectory, hitting a daily high of $84.74. While prices pared some gains later in the session as Iran signaled a potential for renewed diplomatic discussions, the underlying fundamentals suggest a market that is deeply unsettled by the near-total cessation of traffic through the world’s most vital maritime oil artery.
Current data provided by Reuters and CNBC indicates that the risk premium associated with Middle Eastern supply disruptions is being priced in with renewed urgency. The Strait of Hormuz, which typically handles nearly 20 million barrels of oil per day: roughly one-fifth of global consumption: has seen its transit volumes collapse to single digits. According to Energy Intelligence and shipping data trackers, only four vessels were recorded crossing the strait on July 12, and remarkably, no large-scale commercial tankers have been tracked entering or exiting the waterway since July 14. This unprecedented standstill has effectively removed millions of barrels of daily supply from the global balance, forcing refiners to look elsewhere for heavy and medium sour crudes.
Analyzing global oil price volatility and the Hormuz blockade
The physical reality of the blockade has surpassed even the most aggressive bearish scenarios from earlier in the year. The collapse in ship counts is not merely a logistical delay but a structural halt in the global energy value chain. When the Strait of Hormuz remains closed, the global economy loses access to the vast majority of production from Saudi Arabia, Iraq, Kuwait, the United Arab Emirates, and Qatar. While some crude can be diverted through the East-West Pipeline in Saudi Arabia or the Abu Dhabi Crude Oil Pipeline, these routes lack the combined capacity to replace the 20 million barrels per day that typically flow through the strait.
Reports from TankerTrackers and Reuters indicate that Iran managed to ship approximately 60 million barrels during a brief mid-June pause in the naval blockade. However, that temporary window has since slammed shut. The absence of Very Large Crude Carriers (VLCCs) and LNG tankers for nearly a week has created a supply vacuum that is being reflected in front-month pricing. Analysts at S&P Global Commodity Insights have noted that the lack of transit since July 14 is the longest period of total inactivity in the modern history of the energy trade. This total shutdown is the catalyst behind the current spike in global oil price volatility, as market participants grapple with the possibility of a prolonged disruption.

Forecasting global oil price volatility through the second half of 2026
Despite the current peak, many institutional forecasters are attempting to model a return to relative stability toward the end of the year, assuming diplomatic channels remain open. S&P Global Commodity Insights has adjusted its forecast to place Brent between $80 and $90 per barrel for the second half of 2026, though they acknowledge that a continued blockade could push prices significantly higher. The Energy Information Administration (EIA) remains slightly more conservative, forecasting an average of $82 per barrel for the full year of 2026, while Goldman Sachs maintains a target of $80 per barrel for the fourth quarter of 2026.
These forecasts are predicated on the assumption that the current geopolitical tension will eventually resolve into a managed flow of energy. However, the market remains skeptical. The educational context here is important: oil prices do not just reflect current supply and demand; they reflect the cost of future uncertainty. If the market believes that 14 million barrels per day are permanently at risk, the current $91 Brent price may only be the beginning of a larger upward trend.
- S&P Global H2 2026 Brent Forecast: $80–$90 per barrel
- EIA 2026 Average Brent Forecast: $82 per barrel
- Goldman Sachs Q4 2026 Brent Forecast: $80 per barrel
- July 20, 2026 Peak Brent Price: $91.42 per barrel
- July 20, 2026 Peak WTI Price: $84.74 per barrel
Evaluating the stability of global oil price volatility and strategic reserves
As the private market tightens, the focus has shifted toward government-held inventories to provide a much-needed buffer. The United States has been drawing heavily from its Strategic Petroleum Reserve (SPR) to mitigate the impact of the supply shock. According to recent EIA data, U.S. SPR crude stocks have fallen to approximately 316.5 million barrels as of mid-July 2026. This represents the lowest level since April 1983 and indicates that the reserve is currently operating at only 44 percent of its total authorized capacity of 714 million barrels.
The massive drawdown is part of an IEA-coordinated emergency release of 400 million barrels globally, of which the U.S. committed 172 million barrels. While this release has added roughly 2.5 to 3 million barrels per day to the market, it is only a partial offset to the estimated 10 to 14 million barrels per day missing from the Strait of Hormuz transits. The depletion of these reserves is itself a contributing factor to global oil price volatility, as the world’s “insurance policy” against further shocks is being used up.

The global supply buffer is now at its thinnest in decades. While the U.S. still maintains enough crude to meet the IEA’s 90-day net-import protection requirement, the flexibility of the energy system to respond to a second, unrelated disruption: such as a major hurricane in the Gulf of Mexico or technical failure in another region: is severely diminished. Market experts are watching these levels closely, as any indication that the SPR drawdowns will be curtailed could trigger another immediate leg up in pricing.
Technical Market Data and Recent Price Trends
To understand the current trajectory, it is useful to examine the price movements leading up to the July 20 peak. The following data points reflect the closing prices and transit counts observed over the past eight days, illustrating the direct correlation between shipping activity and price action.
| Date (July 2026) | Brent Crude Price (USD) | Strait of Hormuz Tanker Transits |
|---|---|---|
| July 12 | $84.20 | 4 |
| July 13 | $85.45 | 2 |
| July 14 | $87.10 | 0 |
| July 15 | $88.30 | 0 |
| July 16 | $88.95 | 0 |
| July 17 | $89.50 | 0 |
| July 18 | $90.10 (Weekend) | 0 |
| July 19 | $90.85 (Weekend) | 0 |
| July 20 | $91.42 (Intraday Peak) | 0 |
The data shows a clear inverse relationship. As the transit count dropped to zero and remained there for six consecutive days, the price of Brent crude climbed steadily by over $7 per barrel. This is a textbook example of how geopolitical risk is internalized by commodity markets. Until a physical vessel of significant size is seen navigating the strait with its transponder active, the floor for oil prices is likely to remain elevated well above the $80 mark forecasted by agencies earlier in the year.
Structural shifts in the energy economy
What this news means for the broader industry is a forced acceleration of supply chain diversification. The Energy Network Media Group has long tracked the transition toward more resilient infrastructure, and the current crisis highlights why such resilience is mandatory. Producers in the Permian Basin and other North American shale plays are seeing increased demand for immediate delivery, though infrastructure constraints limit how quickly they can bridge a 14 million barrel-per-day gap.
Furthermore, the integration of AI and advanced tracking technologies has allowed analysts to verify these disruptions in real-time, preventing the kind of information lag that used to characterize energy crises in the 20th century. Today, every decision-maker from the White House to the financial analyst in Houston has access to the same satellite data showing the empty waters of the Persian Gulf. This transparency has, paradoxically, fueled global oil price volatility by allowing the market to react instantly to the worsening shipping data.

As we move toward the final quarter of 2026, the industry will be watching for two things: a breakthrough in the diplomatic stalemate regarding the naval blockade and the pace at which the Department of Energy begins to discuss restocking the SPR. Any move to buy back oil for the reserve while the blockade is still in place would add further upward pressure to an already strained market. For now, the global energy economy remains in a defensive posture, waiting for a signal that the world’s most critical passage is once again safe for the flow of global energy.
Keep In Touch with Shale Magazine
As the new era of energy unfolds, you can bet we’ll be the boots on the ground to keep you informed. Subscribe to Shale Magazine for sharp insight into the arenas that matter most to your life. And don’t forget to listen to our riveting podcast, The Energy Mixx Radio Show, where our very own Kym Bolado interviews the most extraordinary thought leaders, business innovators, and industry experts of our time.
Subscribe to get more posts from Amanda Jenkins