Global liquefied natural gas exports grew by about 1.2 trillion cubic feet in 2025. The United States supplied approximately 1.10 trillion cubic feet of that increase.
Put another way, roughly 93% of the world’s additional LNG came from the United States.
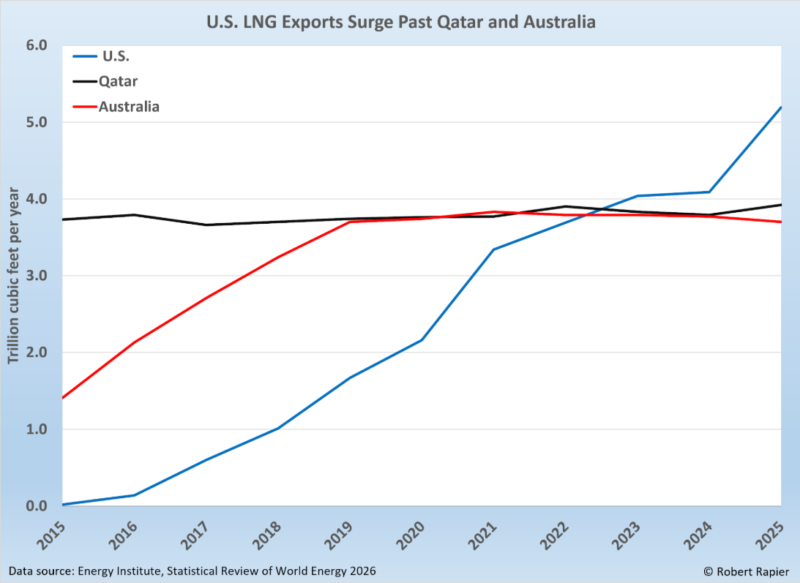
The scale of that contribution is even more striking considering where the industry stood a decade ago. In 2015, the United States exported less than 0.03 trillion cubic feet of LNG. By 2025, exports had reached 5.2 trillion cubic feet, making the United States the world’s largest LNG exporter by a substantial margin.
Data from the Energy Institute’s 2026 Statistical Review of World Energy show that U.S. LNG exports increased 27% last year, up from 4.1 trillion cubic feet in 2024. Total global exports increased from 19.3 trillion cubic feet to 20.4 trillion cubic feet.
The U.S. share of the global LNG export market reached 25.4%. Qatar ranked second with exports of 3.9 trillion cubic feet, followed by Australia at 3.7 trillion cubic feet.
Those numbers represent more than a strong year for American exporters. They show how thoroughly the United States has changed the global natural gas market.
A Decade Changed the Market
In 2015, Qatar dominated LNG exports with 3.7 trillion cubic feet. Australia was still expanding rapidly and exported 1.4 trillion cubic feet. The United States was near zero.
Ten years later, Qatar’s exports were only modestly higher. Australia had climbed into the top tier, but its growth had leveled off. U.S. exports, meanwhile, had risen more than two hundredfold.
That expansion began with the shale revolution, which unlocked enormous volumes of relatively low-cost natural gas. It was reinforced by infrastructure that was already in place along the Gulf Coast, including pipelines, storage facilities, ports, petrochemical complexes, and an experienced energy workforce.
Some of the first LNG export facilities were converted from terminals originally built to import gas. That reversal reflected how dramatically the shale boom had changed expectations. The United States went from preparing for greater dependence on imported gas to building an industry around exporting domestic production.
Plaquemines LNG in Louisiana provided much of the new supply in 2025 as the facility ramped up. Corpus Christi Stage 3 also began adding supply. The International Energy Agency estimates that Plaquemines alone accounted for more than 60% of the increase in global LNG supply during the year.
The structure of many U.S. LNG contracts has also contributed to their appeal. American contracts are often linked to domestic natural gas prices and allow buyers more freedom to redirect cargoes. That flexibility gives customers the option of sending LNG to Europe, Asia, or Latin America depending on prices and demand.
Europe Took Most of the Additional Supply
The Energy Information Administration reports that American LNG shipments to Europe averaged a record 10.3 billion cubic feet per day in 2025, up from 6.3 billion cubic feet per day in 2024. Europe received approximately 68% of total U.S. LNG exports.
Europe still imported LNG from Russia, Qatar, Algeria, Nigeria, and several other producers. None came close to the volume supplied by the United States.
Europe has not ended its reliance on imported energy. What has changed is the way that gas reaches the continent and the number of suppliers competing to provide it.
Pipeline gas connects a producer and customer through fixed infrastructure. An LNG cargo can be redirected while it is in transit. When European prices rise, cargoes that might otherwise have gone to Asia can move toward European terminals instead.
That flexibility provides an important measure of energy security, but it comes with a price. Europe must compete with buyers elsewhere for available cargoes. During a cold winter or a major supply disruption, the competition can become intense.
Market conditions favored Europe in 2025. Asian LNG demand softened, while U.S. shipments to China fell sharply amid trade tensions. More American cargoes were therefore available for European customers willing to pay for them.
Record Production Made the Surge Possible
U.S. natural gas production reached a record 103.9 billion cubic feet per day in 2025, up more than 4% from the previous year and accounting for more than 25% of global production. The U.S. remains by far the world’s largest natural gas producer.
The Appalachia region remained the country’s largest source of natural gas. However, limited pipeline capacity continues to restrict how much additional production can move from the region to major consuming and export markets.
The Permian Basin supplies large volumes of associated natural gas produced alongside crude oil. Because drilling decisions there are often driven by oil prices, Permian gas production can continue growing even when natural gas prices are relatively weak.
The Haynesville region has a different advantage. Its location in eastern Texas and northern Louisiana places it close to several Gulf Coast LNG terminals. That reduces transportation distances and makes the region especially responsive to increasing export demand.
Production growth has allowed the United States to increase LNG exports without abandoning its domestic market. U.S. natural gas consumption also reached a record 88.4 billion cubic feet per day in 2025. At the same time, pipeline exports to Mexico continued to provide another major outlet for American gas.
This is an important distinction. The LNG boom has not been built by dividing a fixed supply among more customers. Producers have added enough output to support rising domestic consumption, pipeline exports, and LNG exports simultaneously.
Whether that balance can be maintained will become increasingly important. Export capacity is growing, electricity demand is rising, and new data centers and industrial facilities are adding load. If production and pipeline construction fail to keep pace, domestic prices will feel more of the pressure from overseas demand.
LNG Is Rewriting Global Gas Trade
The shift toward LNG extends beyond the rise of the United States.
Interregional LNG trade increased by approximately 6.5% in 2025, while interregional pipeline trade declined by about 3.6%. LNG accounted for roughly 55% of interregional natural gas trade, compared with less than 40% a decade earlier.
Natural gas was once primarily a regional commodity. Prices in North America, Europe, and Asia could move independently because limited infrastructure connected the markets.
LNG has weakened those boundaries. A disruption in one region can now affect prices elsewhere by changing where cargoes are sent. The global gas market still is not as integrated as the oil market, but it is moving in that direction.
Recent disruptions to LNG flows through the Strait of Hormuz have reinforced the strategic value of supply originating outside the Persian Gulf. The IEA estimates that LNG moving through the strait had represented almost 20% of global supply before the 2026 disruption.
For American producers, that creates access to a much larger customer base. For domestic consumers, it means U.S. prices will become more sensitive to global supply, weather, and geopolitical events.
More U.S. Capacity Is Coming
The 2025 increase was not a one-time jump. Several U.S. terminals are still ramping up, while others are under construction.
U.S. LNG exports are expected to average around 17 billion cubic feet per day in 2026 and rise again in 2027 as additional capacity enters service. Corpus Christi Stage 3 and Plaquemines will continue expanding, while Golden Pass, Port Arthur, and Rio Grande LNG represent the next wave of large projects.
Projects totaling more than 2.8 trillion cubic feet of annual export capacity reached final investment decisions during 2025. The International Energy Agency expects the United States to supply roughly one-third of the global LNG market by the end of the decade.
There are constraints. LNG terminals require billions of dollars and years of construction. They also need pipelines capable of delivering enormous volumes of feed gas. Developers must be confident that overseas customers will honor long-term commitments and that global demand will remain strong.
The effect on U.S. prices also deserves attention. LNG exports create a valuable market for producers, but every additional terminal adds another source of demand. Consumers have benefited from abundant low-cost natural gas for years. Continued production growth will be required to preserve that advantage.
The Big Picture
The United States did more than lead the world in natural gas production and LNG exports during 2025. It supplied nearly all of the market’s growth.
That is the clearest measure of how important U.S. natural gas has become. Qatar and Australia remain major exporters, but neither is currently adding supply on the same scale. For the moment, the global LNG market is relying on the United States to meet most of its incremental demand.
With more Gulf Coast capacity approaching completion, that role is likely to grow.
This article was written by Robert Rapier, Senior Contributor to Forbes and Editor in Chief of SHALE Magazine. The original version of this article appeared on Forbes.com here.
Keep In Touch with Shale Magazine
As the new era of energy unfolds, you can bet we’ll be the boots on the ground to keep you informed. Subscribe to Shale Magazine for sharp insight into the arenas that matter most to your life. And don’t forget to listen to our riveting podcast, The Energy Mixx Radio Show, where our very own Kym Bolado interviews the most extraordinary thought leaders, business innovators, and industry experts of our time.