
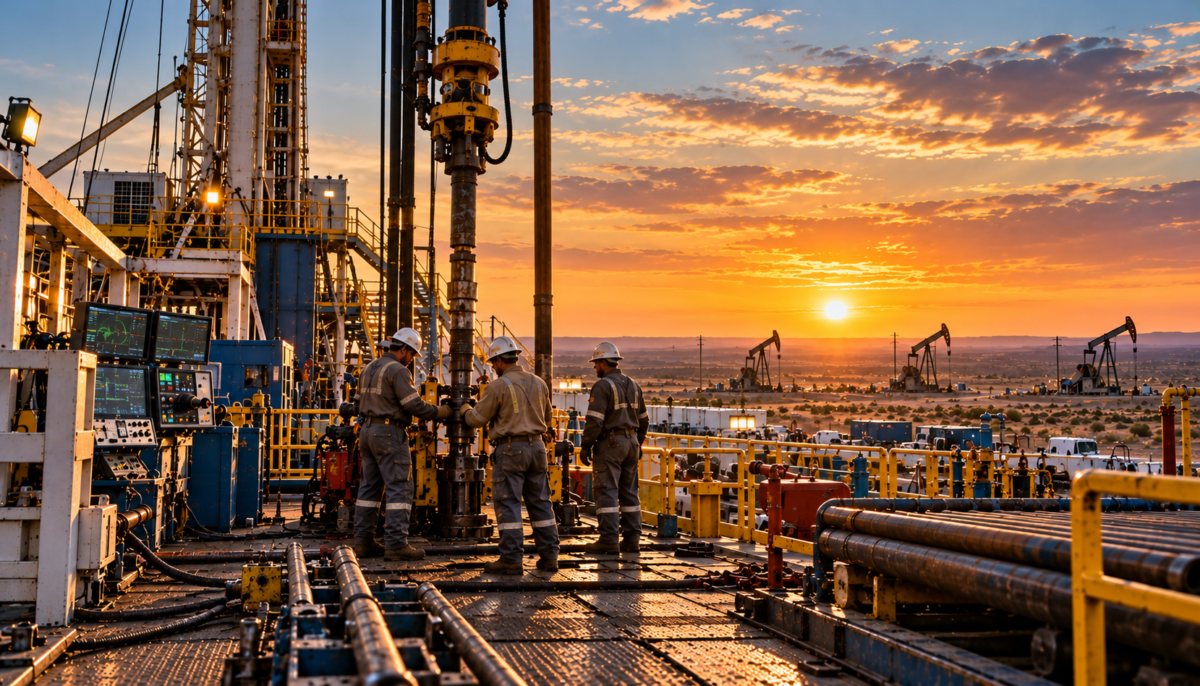
US crude oil production averaged 13.66 million barrels a day in 2025 on Energy Information Administration data, 56% more than in 2014. Employment went the other way. Jobs in oil and gas extraction and in support activities for oil and gas operations averaged about 522,000 in 2014 and about 330,000 in 2025 by Bureau of Labor Statistics counts, roughly 37% fewer. Drilling contractors, a separate industry in the BLS tables, lost about half their jobs over the same years.
Set side by side, the two series work out to about two and a half times as much crude for each of those jobs as in 2014. It’s a loose ratio, since the same workforce also produces natural gas, and dry gas output grew by about half as well. The direction is plain, though: the industry now produces far more with far fewer people, and on roughly 70% fewer drilling rigs by Baker Hughes counts, as the table below shows.
Table 1. US oil and gas output, jobs and rigs, 2014 and 2025 (annual averages)
| Measure | 2014 | 2025 | Change |
| Crude oil production, million barrels a day (EIA) | 8.78 | 13.66 | +56% |
| Dry natural gas production, trillion cubic feet a year (EIA) | 25.9 | 39.3 | +52% |
| Jobs in oil and gas extraction and support activities, thousands (BLS) | 522.2 | 329.8 | -37% |
| Jobs at drilling contractors, thousands (BLS) | 88.9 | 42.7 | -52% |
| Oil and gas rigs in operation (Baker Hughes counts, via EIA) | 1,861 | 561 | -70% |
Source: EIA (crude oil field production, dry natural gas production and rotary rigs in operation, from Baker Hughes); BLS Current Employment Statistics (all employees by industry).
More Barrels per Rig, Fewer People per Barrel
Part of the answer is in the wells. The average new horizontal well in the Permian was drilled with a lateral 77% longer in 2025 than a decade earlier, on Enverus data cited by EIA. Longer wells let producers raise output with fewer rigs and fewer wells, a shift already under way by 2020. In a 2024 comment to the Dallas Fed Energy Survey, one producer’s executive credited more efficient capital spending with record output even as the number of rigs, frac operations and employees came down.
Neither recovery of the past decade brought all the jobs back. On BLS’s monthly figures, the two industries had more jobs in September 2014 than in any month since. The preliminary count for August 2026 is about 60% of that figure.
Where the Know-How Sits
Oil and gas field workers typically learn their trade on the job, and a new hand may start out under the eye of experienced workers. BLS projects about 9,900 openings a year for oil and gas workers over the coming decade, most of them to replace people who move into other occupations or leave the labor force. That makes experienced hands the people to hold on to.
Age doesn’t look like the main threat to that experience. In the 2025 Current Population Survey, 20.9% of workers in support activities for mining, the group that includes oilfield services, were 55 or older, against 23.2% of all employed people.
The cycle is what executives named most often. In the Dallas Fed Energy Survey in early 2023, 40% of executives picked the industry’s ups and downs as the main reason oilfield workers were scarce. In a comment to the same survey, one respondent described most of their operators as having cut staff and “replaced knowledgeable and experienced personnel” with what looked like cheaper newcomers. A services firm’s comment in 2024 named another cause, consolidation among operators, which leaves less continuity of work and makes skilled labor hard to keep.
A late-2023 respondent saw it differently, crediting lower rig counts with leaving the firm’s workforce higher in quality and experience.
The Last Upturn Was a Rehearsal
As activity kept climbing in 2022, labor was one of several constraints. Early that year, one support services executive’s comment to the Dallas Fed survey summed up the problem: the firm had the rigs but not the employees. In the second quarter, executives’ ratings generally showed shortages of personnel, equipment and sand. By June, the Dallas Fed’s Beige Book report pointed to worsening shortages of labor and supplies holding back drilling and completion work in many cases. That summer the frac company Liberty Energy described a tight market, with equipment, supply chain and labor all limiting how many fleets were available.
Labor wasn’t the main brake, though. In the first-quarter survey, 59% of executives named investor pressure for capital discipline as the primary reason public producers were holding back growth.
The harder lesson was about winning people back. One services comment in 2022 described hiring trouble in remote oilfield towns where workers had left both the region and the industry for good between 2015 and 2020. A 2023 comment expected many of those who left in 2020 not to return, attributing it to age or to the industry’s cycles.
This Year’s Test
Oil prices jumped this year. Brent averaged about $117 a barrel in April on EIA data, fell back to about $84 in July and averaged $114 in September. Daily prices topped $125 in early October.
So far the industry is answering with caution. The oil rig count rose about 10% between January and August. The Dallas Fed Energy Survey’s employment index rose to 15.2 in the third quarter, a reading of modest job growth. Its employee hours index climbed to 20.0, a sign of longer hours worked. The competition for experienced people already shows in the survey comments. In June, one support services executive put it plainly: “Competition for experienced field crews is increasing, and customers are hiring our people.”
Some of that competition has come from outside oil and gas. In July, the Dallas Fed’s Beige Book report had oilfield services firms competing harder for skilled workers against power generation and AI. That is the oil and gas side of the point Robert Rapier made in these pages in June, that the power buildout behind AI needs trained workers who can’t be hired overnight.
EIA’s October outlook has US crude output rising to about 14.3 million barrels a day in 2027. That growth would rest on a workforce that has come back smaller after both downturns of the past decade.
The leaner model has worked for output. Its weak spot is the one executives have pointed to for years: each bust pushes experienced people out, and jobs haven’t returned to their September 2014 level after either downturn. BLS’s monthly count for support activities and the Dallas Fed survey’s quarterly employment and hours indexes will show whether this upturn hires people back or asks more of the ones it already has.
Summary
US crude output rose 56% between 2014 and 2025 while BLS counted about 37% fewer jobs in oil and gas extraction and in support activities for oil and gas operations. Drawing on BLS, EIA and Dallas Fed Energy Survey data, the article looks at how oilfield know-how holds up in a smaller workforce and at what the last upturn and this year’s price jump show about how fast the industry can staff up again.
This article was submitted by a guest contributor and reflects the author’s professional experience, analysis, and opinions. It was reviewed by ENMG for editorial quality, accuracy, and adherence to our publication standards. Any affiliations, disclosures, or potential conflicts of interest identified by the author are noted within the article where applicable.

About the Author
Kendall Kunz is Chief Revenue Officer at Appenate. Disclosure: Appenate’s software is used to build mobile apps that capture data in the field, and the company lists oil and gas among the industries it serves. This article does not discuss its products.
Sources
- U.S. Energy Information Administration (EIA), U.S. Field Production of Crude Oil, annual, series MCRFPUS2. https://www.eia.gov/dnav/pet/hist/LeafHandler.ashx?n=PET&s=MCRFPUS2&f=A
- U.S. Bureau of Labor Statistics (BLS), Current Employment Statistics, all employees, oil and gas extraction, not seasonally adjusted, annual averages, series CEU1021100001. https://data.bls.gov/timeseries/CEU1021100001
- BLS, Current Employment Statistics, all employees, support activities for oil and gas operations, not seasonally adjusted, annual averages, series CEU1021311201. https://data.bls.gov/timeseries/CEU1021311201
- BLS, Current Employment Statistics, all employees, drilling oil and gas wells, not seasonally adjusted, annual averages, series CEU1021311101. https://data.bls.gov/timeseries/CEU1021311101
- U.S. Census Bureau, 2022 North American Industry Classification System Manual, industries 213111 and 213112. https://www.census.gov/naics/reference_files_tools/2022_NAICS_Manual.pdf
- EIA, U.S. Dry Natural Gas Production, annual, series N9070US2. https://www.eia.gov/dnav/ng/hist/n9070us2a.htm
- EIA, U.S. Crude Oil and Natural Gas Rotary Rigs in Operation, annual (Baker Hughes counts). https://www.eia.gov/dnav/pet/hist/LeafHandler.ashx?n=PET&s=E_ERTRR0_XR0_NUS_C&f=A
- EIA, Today in Energy, “Longer wells boost Permian crude oil and natural gas production” (August 19, 2026). https://www.eia.gov/todayinenergy/detail.php?id=67984
- EIA, Today in Energy, “U.S. crude oil and natural gas production in 2019 hit records with fewer rigs and wells” (June 25, 2020). https://www.eia.gov/todayinenergy/detail.php?id=44236
- Federal Reserve Bank of Dallas, Dallas Fed Energy Survey, second quarter 2024, respondent comments (June 26, 2024). https://www.dallasfed.org/research/surveys/des/2024/2402
- BLS, Current Employment Statistics, all employees, seasonally adjusted, monthly, series CES1021100001 (oil and gas extraction) and CES1021311201 (support activities for oil and gas operations). https://data.bls.gov/timeseries/CES1021311201
- BLS, Occupational Outlook Handbook, Oil and Gas Workers. https://www.bls.gov/ooh/construction-and-extraction/oil-and-gas-workers.htm
- BLS, Current Population Survey, Table 18b, Employed people by detailed industry and age, 2025 annual averages. https://www.bls.gov/cps/cpsaat18b.htm
- Dallas Fed Energy Survey, first quarter 2023, special questions and respondent comments (March 29, 2023). https://www.dallasfed.org/research/surveys/des/2023/2301
- Dallas Fed Energy Survey, third quarter 2024, respondent comments (September 25, 2024). https://www.dallasfed.org/research/surveys/des/2024/2403
- Dallas Fed Energy Survey, fourth quarter 2023, respondent comments (December 20, 2023). https://www.dallasfed.org/research/surveys/des/2023/2304
- Dallas Fed Energy Survey, first quarter 2022, special questions and respondent comments (March 23, 2022). https://www.dallasfed.org/research/surveys/des/2022/2201
- Dallas Fed Energy Survey, second quarter 2022, special questions and respondent comments (June 23, 2022). https://www.dallasfed.org/research/surveys/des/2022/2202
- Federal Reserve, Beige Book, June 2022, Federal Reserve Bank of Dallas district. https://www.federalreserve.gov/monetarypolicy/beigebook202206.htm
- Liberty Energy Inc., second quarter 2022 financial and operational results (July 25, 2022). https://investors.libertyenergy.com/~/media/Files/L/Liberty-OilField-IR-V3/press-release/final-earnings-release.pdf
- EIA, Europe Brent Spot Price FOB, monthly (series RBRTE) and daily (series RBRTED). https://www.eia.gov/dnav/pet/hist/RBRTED.htm
- EIA, U.S. Crude Oil Rotary Rigs in Operation, monthly (Baker Hughes counts). https://www.eia.gov/dnav/ng/hist/e_ertrro_xr0_nus_cm.htm
- Dallas Fed Energy Survey, third quarter 2026 (September 30, 2026). https://www.dallasfed.org/research/surveys/des/2026/2603
- Dallas Fed Energy Survey, second quarter 2026, respondent comments (June 24, 2026). https://www.dallasfed.org/research/surveys/des/2026/2602
- Federal Reserve, Beige Book, July 2026, Federal Reserve Bank of Dallas district. https://www.federalreserve.gov/monetarypolicy/beigebook202607-dallas.htm
- Robert Rapier, “AI’s Growth Depends On The Energy Workforce,” SHALE Magazine (June 8, 2026). https://shalemag.com/ai-energy-workforce-demand/
- EIA, Short-Term Energy Outlook (October 6, 2026). https://www.eia.gov/outlooks/steo/